The T-RBI server maps your single-cell RNA-seq data onto the immgenT framework (Magill et al. 2026), including cell embeddings (dimensionality reductions), lineage annotations, and cluster annotations.
The pipeline generates:
- A CSV file containing lineage and cluster annotations, associated scANVI confidence scores, and a discovery score highlighting potential novel states
- CSV files containing MDE coordinates (allT and lineage-specific MDE spaces)
- A PDF summary with plots and QC metrics
You may import the results as metadata into a Seurat or AnnData object for downstream analyses such as differential gene expression.
DATA SUBMISSION GUIDELINES
WHAT CELLS CAN BE SUBMITTED?
- Mouse T cells only
- Recommended dataset size: ~10,000 cells; maximum accepted: 25,000 cells
- This pipeline was developed and tested on scRNA-seq data generated using the 10x Genomics Chromium platform. Performance on other platforms has not been systematically evaluated.
- Please perform quality control and submit only post-QC cells. Your dataset should:
- Contain real cells (empty droplets and doublets removed)
- Include high-quality cells (>300 detected genes per cell; >500 RNA counts per cell)
- Contain primarily T cells (minor contamination is acceptable). Submitting mixed CD45+ populations is strongly discouraged.
- Contain only the cells you choose from the "type of t cells in your data" selection - when selecting CD8, you should only have conventional CD8αβ+TCRαβ+ T cells in your data.
- Include RNA counts only (no protein, ADT, or other modalities)
- If your dataset was multiplexed using hashtags/HTOs, demultiplex the data and assign each cell to a sample. Include this information in the cell_batch.csv file.
REQUIRED INPUT FILES
To run T-RBI, please submit the following files:
-
matrix.mtx (.gz optional) – Required
An RNA count matrix in Matrix (.mtx) format for all cells (across datasets/samples).
-
genes.tsv(.gz optional) – Required
A one-column list of NCBI Gene Symbols corresponding to the rows of your matrix.
- Do NOT submit ENSEMBL IDs, ENTREZ IDs, etc.
- Do NOT pre-filter genes (e.g., highly variable genes only). Submit all genes.
- Required genes for QC, T cell filtering, and γδ T cell identification (the run will stop if they are missing):
-
T cell genes: Trav14-1, Trgv2, Trac, Cd3e, Foxp3, Izumo1r, Cd40lg, Dapl1, Cd5, Trat1, Cd3d, Zfp683, Themis, Esm1, Cd3g, Il10, Sdcbp2, Olfr524, Ly6c1, Sox13, Syt13, Gzmk
-
γδ T cell genes: Trdv1, Trdv2-1, Trdv2-2, Trdv3, Trdv4, Trdd1, Trdd2, Trdj1, Trdj2, Trdc, Trdv5, Trgv7, Trgv4, Trgv6, Trgv5, Trgj1, Trgc1, Trgv3, Trgj3, Trgc3, Trgc2, Trgj2, Trgv2, Trgv1, Trgj4, Trgc4, Sox13
-
barcodes.tsv(.gz optional) – Required
A list of unique cell IDs corresponding to the columns of your matrix.
- Ensure cell IDs are unique. Barcodes alone are insufficient when combining multiple 10x lanes.
-
cell_batch.csv – Required
Relates each cell to a batch (corresponding to an encapsulation run); required when submitting multiple batches together. If your dataset is from one batch, enter the same batch ID for every cell.
- Column names must match exactly:
- Cell_ID – must exactly match the cell IDs in barcodes.tsv
- batch – batch identification
- In most cases, a sample corresponds to a single encapsulation run. If multiplexed via hashtags, each hashtag within an encapsulation run corresponds to one sample.
WHAT DOES THE T-RBI PIPELINE DO?
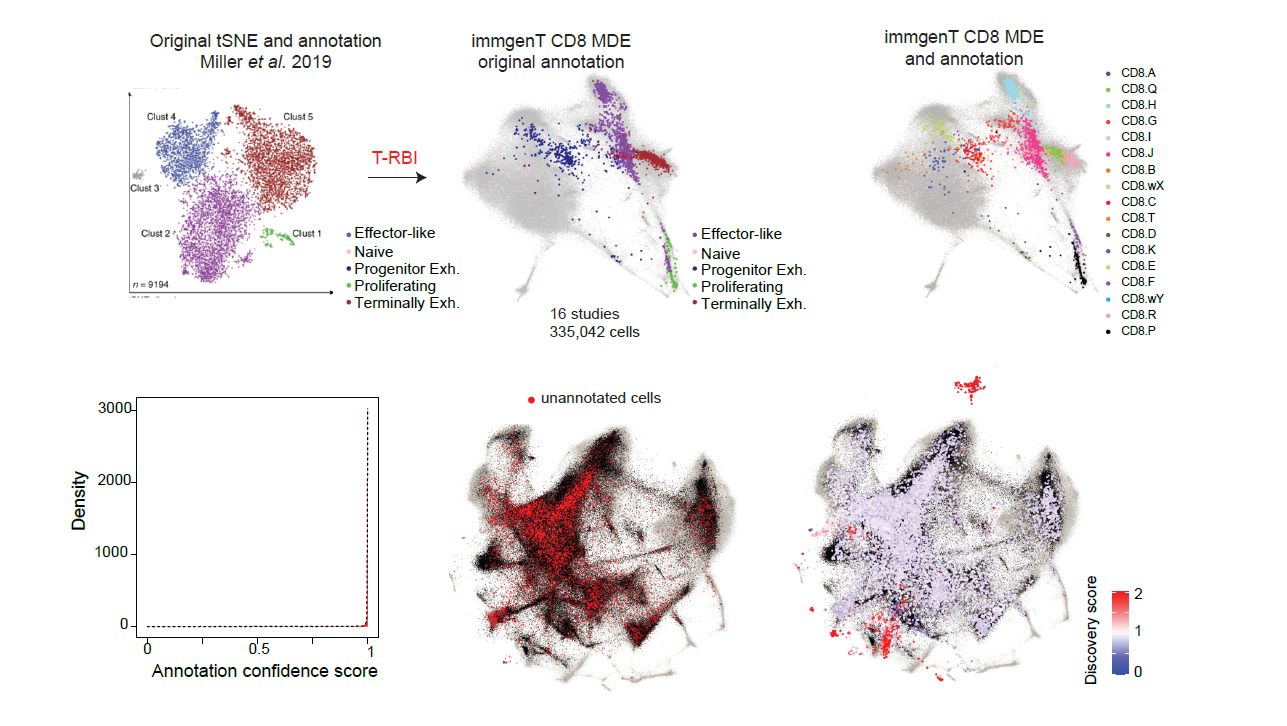
T-RBI uses scVI (Lopez et al. 2018) to integrate your samples with the immgenT reference and scANVI (Xu et al. 2021) for annotation. Each cell receives predictions at two levels: lineage (e.g., CD4, CD8, Treg) and lineage cluster (e.g., CD4.A).
For visualization and embedding, PyMDE (Agrawal et al. 2021) (Minimal Distortion Embedding) projects your cells into the immgenT MDE space. Cells are first mapped to the global “all T” MDE space and assigned to a major lineage. Based on this assignment, they are then mapped into lineage-specific MDE spaces (CD4, CD8, Treg, gdT, CD8aa, Tz, DN, DP).
Cells are not forced into the reference. Low-probability or poorly fitting cells are flagged as "not classified," and scANVI confidence scores (per-class probability) are reported.
A discovery score is calculated to identify putative new cell states not represented in immgenT. The discovery score is computed as the ratio of k-nearest-neighbor distances to unannotated versus annotated cells in the query dataset’s native PCA space, independently of immgenT integration (threshold 1.1 for boolean classification).
Currently, T-RBI supports mapping to the full immgenT reference dataset (across all lineages). Samples containing mixed T cell populations (CD4, CD8, etc.) perform best when mapped to the full “all T” reference.
If you sorted a specific population (e.g., CD8 T cells only), performance may vary when selecting "allT". In such cases, select the immgenT lineage reference that best represents your data. Note that we trust your dataset to be clean and only contain cells from your chosen population, so be careful of contamination. You will see false discoveries or weird annotations for these contaminating cells. Make sure these cells are supposed to be there before accepting the results.
LINEAGE DEFINITIONS IN immgenT (Magill et al. 2026):
- gdT: γδ TCR+ T cells
- Treg: CD4+ Foxp3+ regulatory T cells
- CD4 (Tconv): CD4+ Foxp3− conventional T cells (does not include Tregs)
- CD8: CD8αβ+ T cells
- CD8aa: CD8α+ CD8β− αβ T cells (does not include CD8aa γδ T cells)
- Tz: Zbtb16+ unconventional T cells (e.g., iNKT, MAIT; excludes γδ T cells)
- DN: CD4− CD8α− mature αβ T cells (non-thymic; excludes gdT and Tz)
- DP: CD4+ CD8α+ mature αβ T cells (non-thymic)
PIPELINE STEPS:
- Filters low-quality cells (>300 detected genes per cell required)
- Removes non-T cells using required gene markers (only when selecting "allT")
- Identifies γδ T cells using required TCR genes (only when selecting "allT")
- Iteratively applies scVI and scANVI until annotation confidence converges
- Projects cells into immgenT MDE reference spaces (global and lineage-specific)
- Computes a discovery score for unannotated cells
OUTPUT FILES
allT
T-RBI.pdf includes:
- Histogram of scANVI confidence scores
- allT MDE plot colored by immgenT lineage annotations
- allT MDE plot colored by user sample
- Feature plots (Cd4, Cd8a, Cd8b, Foxp3, Zbtb16, Trdc)
- Lineage-specific MDE plots (if ≥20 cells assigned)
- Unannotated cells highlighted in the query dataset UMAP
- allT MDE plot with discovery score
- allT MDE plot with discovery cells
T-RBI_annotation.csv contains:
- cellID: submitted cell IDs
- level1: lineage annotation (CD4, CD8, Treg, gdT, CD8aa, Tz, DN, DP)
- level2: cluster within each lineage (e.g., CD4.A, CD8.D)
- confidence_score: scANVI per-class probability
- discovery_score: 0–Inf; score > 1 indicates potentially novel states (e.g., 1.1 means cells more than 10% closer to each other than to annotated cells)
- Discovery: True/False (threshold 1.1)
MDE coordinate files (generated if ≥20 cells assigned): AllT_mde.csv, CD4_mde.csv, CD8_mde.csv, Treg_mde.csv, gdT_mde.csv, CD8aa_mde.csv, Tz_mde.csv, DN_mde.csv, DP_mde.csv
- MDE1: x-coordinate in the immgenT MDE space
- MDE2: y-coordinate in the immgenT MDE space
Lineage only (CD8, CD4 etc.)
T-RBI.pdf includes:
- Histogram of scANVI confidence scores
- Lineage MDE plot colored by immgenT lineage annotations
- Lineage MDE plot colored by user sample
- Feature plots (Cd4, Cd8a, Cd8b, Foxp3, Zbtb16, Trdc)
- Unannotated cells highlighted in the query dataset UMAP
- Lineage MDE plot with discovery score
- Lineage MDE plot with discovery cells
T-RBI_annotation.csv contains:
- cellID: submitted cell IDs
- level2: cluster within each lineage (e.g., CD4.A, CD8.D)
- confidence_score: scANVI per-class probability
- discovery_score: 0–Inf; score > 1 indicates potentially novel states (e.g., 1.1 means cells more than 10% closer to each other than to annotated cells)
- Discovery: True/False (threshold 1.1)
MDE coordinate files (depending on Lineage selection): CD4_mde.csv, CD8_mde.csv, Treg_mde.csv, gdT_mde.csv, CD8aa_mde.csv, Tz_mde.csv, DN_mde.csv, DP_mde.csv
- MDE1: x-coordinate in the immgenT MDE space
- MDE2: y-coordinate in the immgenT MDE space
TIPS
Use the results critically:
- Examine whether your cells overlap with immgenT. Lack of overlap may indicate suboptimal integration.
- Inspect marker expression (CD4, CD8, Foxp3, Zbtb16, etc.). If marker expression does not align with expected lineages, this may indicate poor integration.
- Performance has not been tested on:
- Different strains beyond B6 and NOD
- In vitro samples
- Thymocytes
- Do not submit human or non-mouse data.
- Knockout models may rewire transcriptional programs and may not map optimally.
- CD8aa αβ T cells and CD8aa γδ T cells partially overlap transcriptionally and may occasionally be misclassified.
To improve integration:
- Carefully follow these guidelines
- Consider mapping to specific lineages instead of the full immgenT reference
JOB MONITORING
- Each submission receives a status page.
- You will receive an email notification when your job is complete.
- Typical runtime: 12–24 hours.
REFERENCES
- Agrawal, Akshay, Alnur Ali, and Stephen Boyd. 2021. “Minimum-Distortion Embedding.” Foundations and Trends® in Machine Learning 14 (3): 211–378. https://doi.org/10.1561/2200000090
- Croze, Myriam, Liang Yang, Serge Candéias, et al. 2026. “The αβTCR Repertoire at Scale in the immgenT Dataset.” bioRxiv, February 2. https://doi.org/10.64898/2026.01.30.702900
- Freuchet, A., N. Mehrotra, I. Magill, et al. 2026. “ImmgenT Treg: A Reference Landscape of Regulatory T Cell States in Mice.” bioRxiv, February 2. https://doi.org/10.64898/2026.01.30.702856
- Galletti, Giovanni, Anna-Maria Globig, Olga Barreiro, et al. 2026. “The CD8 immgenT Framework as a Universal Reference of Mouse CD8αβ T Cell Differentiation States.” bioRxiv, February 4. https://doi.org/10.64898/2026.02.02.703365
- Lopez, Romain, Jeffrey Regier, Michael B. Cole, Michael I. Jordan, and Nir Yosef. 2018. “Deep Generative Modeling for Single-Cell Transcriptomics.” Nature Methods 15 (12): 1053–1058. https://doi.org/10.1038/s41592-018-0229-2
- Magill, Ian, Odhran Casey, Dania Mallah, et al. 2026. “ImmgenT: A Comprehensive Reference of Convergent T-Cell States in the Mouse.” bioRxiv, February 2. https://doi.org/10.64898/2026.01.30.702892
- Xu, Chenling, Romain Lopez, Edouard Mehlman, Jeffrey Regier, Michael I. Jordan, and Nir Yosef. 2021. “Probabilistic Harmonization and Annotation of Single-Cell Transcriptomics Data with Deep Generative Models.” Molecular Systems Biology 17 (1): e9620. https://doi.org/10.15252/msb.20209620