Population Comparison help
Performs a comparison of gene expression between populations (or groups of populations), and returns a ranked table of the genes that most distinguish them.
Use for a simple pairwise comparison (e.g. Follicular B vs GC B cells) or for comparison between groups of populations (e.g. all CD4+ T vs all CD8+ T cells).
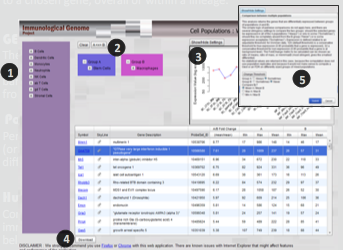
First select the populations to be compared by navigating the ImmGen population tree (1), then drag-and-drop the chosen population(s) into either the A or B box (2).
If a simple pairwise differential, click Submit, will return a table of genes and differential metrics (FoldChange, t.test p-value, Benjamini-Hochberg FDR). The table shows the upper and lower extremes of the distribution, and can be sorted by any of the columns. Clicking on one gene brings up a plot of expression values across the selected cell-types (3). The table can be downloaded (4).
If comparing between groups of cell-types, the system asks for indications on how to compute the differential (5). To find exclusive genes, select those “Never” or “Always” present in A or B groups; use “sometimes” for non-exclusive lists. Also select whether the FoldChange should be calculated between the Mean, Max or Min expression values in the groups of populations.